Running TTN Prometheus Exporter as systemd Service

Background

In previous posts we presented a Prometheus exporter to monitor for monitoring TheThingsNetwork gateways. The exporter can directly be executed in a terminal. However, to use it productively it should run in the background as a service. This article demonstrates how this can be achieved using the system and service manager systemd on Linux systems.

Preparation

The first step is to prepare the environment where the Prometheus exporter is installed. Throughout this article we will use the directory /usr/local/bin/prometheus-ttn-exporter. However, any other directory in the local file system is also possible.

Executing the exporter as root is possible, but not ideal. To reduce the privileges as much as possible, it is a better idea to create a system user and group. In our example the user and group is called ttn. We need to ensure that the directory as well as all contained files are owned by the ttn user and group.

Inside the directory we need to place the files ttn_gateway_exporter.py and requirements.txt both as provided in the Github Repository. To isolate the the exporter and its dependencies from the rest of the system, we will use a Python virtual environment (venv). Please note, that with this approach updates are not automatically installed when updating the rest of the system. You must ensure to update the Python venv on your own. The venv can be prepared by executing the following commands as the ttn user.

virtualenv --python=python3 venv
source venv/bin/activate
pip install -r requirements.txt
deactivate

With this the environment is prepared and the systemd service can be created.

Systemd

Systemd services are defined in text files. A common location for these service files is the directory /etc/systemd/system/. For our example we will create the service file /etc/systemd/system/ttn.service. The minimal content of this file is as follows.

[Unit]
Description=ttn prometheus exporter
Requires=network-online.target
After=network-online.target

[Service]
User=ttn
Group=ttn

ExecStart=/usr/local/bin/prometheus-ttn-exporter/venv/bin/python /usr/local/bin/prometheus-ttn-exporter/ttn_gateway_exporter.py --listen :9715 --key API_KEY

[Install]
WantedBy=multi-user.target

The downside of this minimal example is that the TheThingsNetwork API key is directly stored in the system service file. So every user who is allowed to read the service file can access the API key. Depending on your deployment scenario this might be sufficient. If not other options would be to store the API key directly in the exporter directory and restrict the file access appropriately.

The last step is to reload the available systemd service files and start the new ttn service by executing:

systemctl daemon-reload
systemctl start ttn.service

You can now verify that the Prometheus exporter is running by opening http://localhost:9715 in a browser.

The Things Stack Gateway Monitoring

Background

In previous posts we showed how the status of TheThingsNetwork gatways can be monitored. With the switch of the underlying infrastructure to TheThingsStack this becomes even easier, because the API allows direct access to the relevant statistics of the gateways. It is now also possible to authenticate with a (personal) API key, such that the login procedure becomes also easier to handle.

API Key

The first step is to create an API key with the appropriate permissions. This can be done in the console of TheThingsNetwork, by clicking on your username in the upper right corner and selecting the option Personal API Keys. You have to create a token with at least the permissions view gateway status and list gateways the user is a collaborator of.

Prometheus TTN Gateway Exporter

The changes of the prometheus exporter are minimal, because the authentication becomes easier with the API key. The main changes are the different API calls compared to the previous version. Besides that the things mentioned in the previous article are still applicable. The code on Github is already updated.

import signal
import sys
import threading

import requests
from absl import app
from absl import flags
from absl import logging
from cachetools import cached, TTLCache
from prometheus_client import start_wsgi_server, Gauge

FLAGS = flags.FLAGS
flags.DEFINE_string('listen', ':9714', 'Address:port to listen on')
flags.DEFINE_string('key', None, 'API key')
flags.DEFINE_string('password', None, 'Password to authenticate with')
flags.DEFINE_bool('verbose', False, 'Enable verbose logging')

exit_app = threading.Event()

TOKEN = None
EXPIRES = None

cache = TTLCache(maxsize=200, ttl=10)


@cached(cache)
def get_gateway_stats(gateway_id):
    session = requests.Session()
    header = {'Authorization': 'Bearer ' + FLAGS.key}
    res = session.get('https://eu1.cloud.thethings.network/api/v3/gs/gateways/%s/connection/stats' % gateway_id, headers=header)
    return res.json()


@cached(cache)
def get_gateway_ids():
    session = requests.Session()
    header = {'Authorization': 'Bearer ' + FLAGS.key}
    res = session.get('https://eu1.cloud.thethings.network/api/v3/gateways', headers=header)
    return [gateway['ids']['gateway_id'] for gateway in res.json()['gateways']]


def collect_metrics(gateway_id, metric) -> int:
    gateway_stats = get_gateway_stats(gateway_id)
    if metric in gateway_stats:
        return int(gateway_stats[metric])
    return 0


def prepare_metrics():
    logging.debug('prepare metrics')
    for metric in ['uplink_count', 'downlink_count']:
        gauge = Gauge('ttn_gateway_messages_%s' % metric, 'Number of %s messages' % metric, labelnames=['gateway_id'])
        for gateway_id in get_gateway_ids():
            gauge.labels(gateway_id=gateway_id).set_function(lambda i=gateway_id, m=metric: collect_metrics(i, m))


def quit_app(unused_signo, unused_frame):
    exit_app.set()


def main(unused_argv):
    if FLAGS.verbose:
        logging.set_verbosity(logging.DEBUG)
    if FLAGS.key is None:
        logging.error('Provide API key!')
        sys.exit(-1)

    prepare_metrics()

    address, port = FLAGS.listen.rsplit(':', 1)
    start_wsgi_server(port=int(port), addr=address)
    logging.info(f'Listening on {FLAGS.listen}')
    for sig in (signal.SIGTERM, signal.SIGINT, signal.SIGHUP):
        signal.signal(sig, quit_app)
    exit_app.wait()


if __name__ == '__main__':
    app.run(main)

To execute the exporter you need to pass the API key from the previous step by executing python ttn-gateway-exporter.py --key API_KEY.

Traceability in Simulation Studies

This article deals with a challenge of simulation studies. In particular it deals with traceability. We define what the term traceability means and what is not meant by it. Additionally we illustrate a concept how to achieve traceability with established methods from software engineering.

What is traceability

The term traceability describes the fact that all steps necessary to create results with simulation studies are linked with each other. Thereby traceability is the foundation of reproducible simulation results. A basic workflow when producing results out of simulation study consists of the following steps.

  1. Development of the simulation model
  2. Configuring the simulation model
  3. Executing the simulation study
  4. Collecting the simulation results
  5. Post-processing the simulation results, e.g. into plots

With traceability it is possible to link all steps. E.g. it is possible to link a plot to the execution environment used to run the study. The execution environment is linked to the configuration of the simulation model and the configuration is finally linked to the source code of the model itself.

It is important to mention that traceability does not guarantee that the simulation results are correct. This brings us to the next section, which discusses what traceability is not.

What traceability is not

Traceability may not be mixed up with validity or credibility of simulations. While there are methods, partly also known in software engineering, to ensure the correctness of simulations, it is in general much more difficult to guarantee the credibility of simulations.

This topic deserves an own article and will be covered in a later post.

How to achieve traceability

Traceability is already widely adopted in software engineering, even if it is not known under this term. The remainder of this article will discuss these concepts and illustrate how these can be applied to simulation studies.

Version control

A version control system allows to keep a complete history of changes applied to a set of files. This allows to track all changes as well as to restore older versions. Each version is identified by an unique identifier. While version control systems can manage all kind of files, they work especially well for text based files because there the changes can directly be shown and read by the users of the version control. Therefore, all source code used in simulation studies, e.g. the source code of the model, configuration files, scripts to execute the simulation or collect the results, and also the results themselves, should be manged by version control systems.

Versioning

If the simulation depends on external libraries or tools, the exact version of the tools should be included in the configuration of the study. The configuration itself should be managed by a version control system. Thereby, the different components are linked and traceability is achieved.

Meta data

Finally, meta data allows to embed additional information in other data, e.g. plots of simulation results. A plot should contain the exact version of the simulation environment as meta data. Thereby, it is traceable how this plot has been created and thereby also how the simulation model has been executed and configured and what the exact version of the simulation model was.

Scalable Setup for Simulation Studies

Introduction

When executing simulations one is often facing the task to running simulation studies with varying parameters. The simulation results are then plotted as a family of curves. Especially in the case of discrete event simulations, the task of running the complete simulation study can be efficiently distributed on multiple compute nodes, as every parameter combination can be treated as an individual simulation. This article describe a scalable yet inexpensive setup to execute such simulation studies.

As a disclaimer it shall be mentioned, that scalability of course has limitations and there are good reasons why there are dedicated architectures for high performance computing. Yet for the purpose of discrete event simulations the presented setup is a suitable choice.

Setup

The diagram below depicts the setup, which consists of multiple compute nodes, a central, shared storage system and a node to control the simulation. Even if the diagram shows these roles as individual nodes, a single node can act in multiple roles. E.g. a compute node can act at the same time as storage system or control node. The bottleneck in such a setup is usually the storage system, but alternatives like distributed file systems can improve the performance.

Simulation Setup

The structure of the simulation study, i.e. the different parameters and their values can be directly reflected in the shared file system provided by the central storage system.

File System Structure

As all nodes share the same file system, the parameters, their values but also the simulation results can be stored in this file system. This allows to manage the simulation study, i.e. adding or removing parameters, with native tools provided by the operating system. But of course the simulation study can also be managed with specialized tools.

In the following we will call the file system directory, that holds the simulation study, study root. The study root can one the one hand contain the parameters, values and results, but on the other hand also all scripts or binaries to actually execute the simulation. The listing below shows an example of an empty study root.

├── MetaData
└── Results
    ├── ParaS__Strategy__ProportionalFair
    │   ├── ParaF__Load__0.1
    │   ├── ParaF__Load__0.5
    │   └── ParaF__Load__1.0
    └── ParaS__Strategy__RoundRobin
        ├── ParaF__Load__0.1
        ├── ParaF__Load__0.5
        └── ParaF__Load__1.0

The directory MetaData contains configuration files, the simulation binaries and parameter file templates. The directory Results holds the structure of the study root, i.e. the parameters and their values. In this case the parameter Strategy of type string with the values ProportionalFair and RoundRobin and the parameter Load of type float with the values 0.1, 0.5 and 1.0 exists. All files created by the simulation binary would be created as leaves of a specific parameter combination.

The parameter file template could look as follows.

Network.Load = %%Load%%
Scheduler.Strategy = %%Strategy%%

Simulation Control

The task of the simulation control are twofold. The first task is to manage the study root, i.e. creating it, adding parameters and values. The second task is to actually execute the simulation study. While the first task can also be performed with native programs, the second task requires special tooling.

To execute the simulation for a single parameter combination, the simulation control reads the parameter file template located in the directory MetaData, replaces all placeholders with the actual values of the parameters and writes the parameter file in the corresponding leaf in the study root. For example for the parameter combination Strategy = ProportionalFair and Load = 0.1, the simulation control would replace the placeholders %%Strategy%% with ProprtionalFair and %%Load%% with 0.1. The resulting parameter file would be written in the directory ./Results/ParaS__Strategy__ProportionalFair/ParaF__Load__0.1.

After creating the parameter file, the simulation control executes the simulation binary remotely on one of the available compute nodes. Additionally the working directory is set correspondingly and the created parameter file is passed to the simulation binary. For this purpose standard tooling like SSH is used.

Additional scheduling rules can be considered by the simulation control, e.g. in order to prioritize some parameter combinations or compute nodes. Also the available capacity of the compute nodes with respect to compute resources or memory can be considered.

Tooling

As mention special tooling to manage simulation studies exists. An example of such a tool is IKR SimTree which is developed by the Institute of Communication Networks and Computer Engineering of the University of Stuttgart. However, IKR SimTree is not actively maintained and has some special dependencies to the infrastructure it is executed on.

This is why we will publish a complete rewrite name SimTreeNG in the near future. Also, we will discuss in future articles the details of the setup we briefly introduces in this article.

Adafruit Feather M0 as LoRaWAN Device

In a previous article we showed how an own TTN LoRaWAN gateway can be built using a Raspberry Pi. This article shows how a LoRaWAN device can be built. There are multiple options, however we use an Adafruit Feather.

There are multiple tutorials available. For example Adafruit provides a detailed guide.

Adafruit Feather

The Adafruit Feathers are a family of micro-controllers. All share the same layout such that extensions in the form of so called Wings can be used. Some Feathers already contain sensors or communication modules. For example the Adafruit Feather M0 is also available with a LoRaWAN communication module.

All Feathers can be programmed using the Arduino IDE such that it is very easy to get started. Consequently the Adafruit Feathers are a good solution for many IoT solutions.

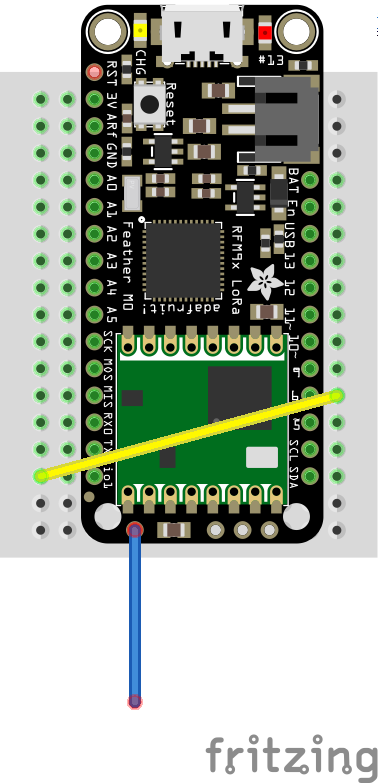
The Feather M0 is almost ready to use. The only necessary steps are to add a jumper wire and to solder an antenna to it. For the 868 MHz frequency range a simple wire with a length of 8,2 cm is sufficient as antenna. For first tests the Feather M0 can be connected via its USB port for power supply.

Adafruit Feather M0 Wiring

Create a TTN Application

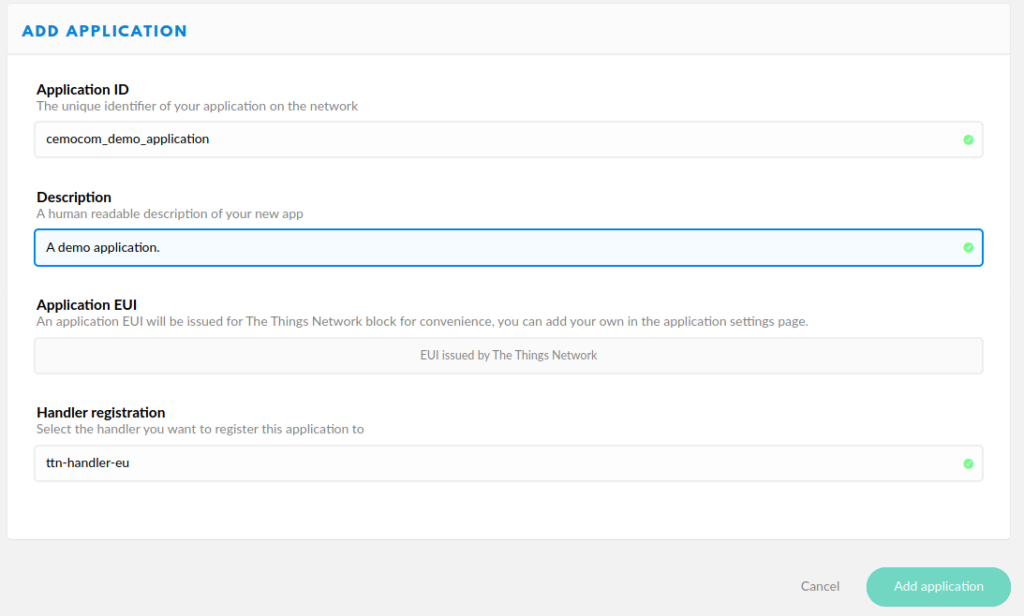
The next step is to create a new TTN application. This can be done by logging in to https://console.thethingsnetwork.org. After logging in select applications and create a new application. A dialog opens where the details of the new application can be entered.

TTN Application Creation

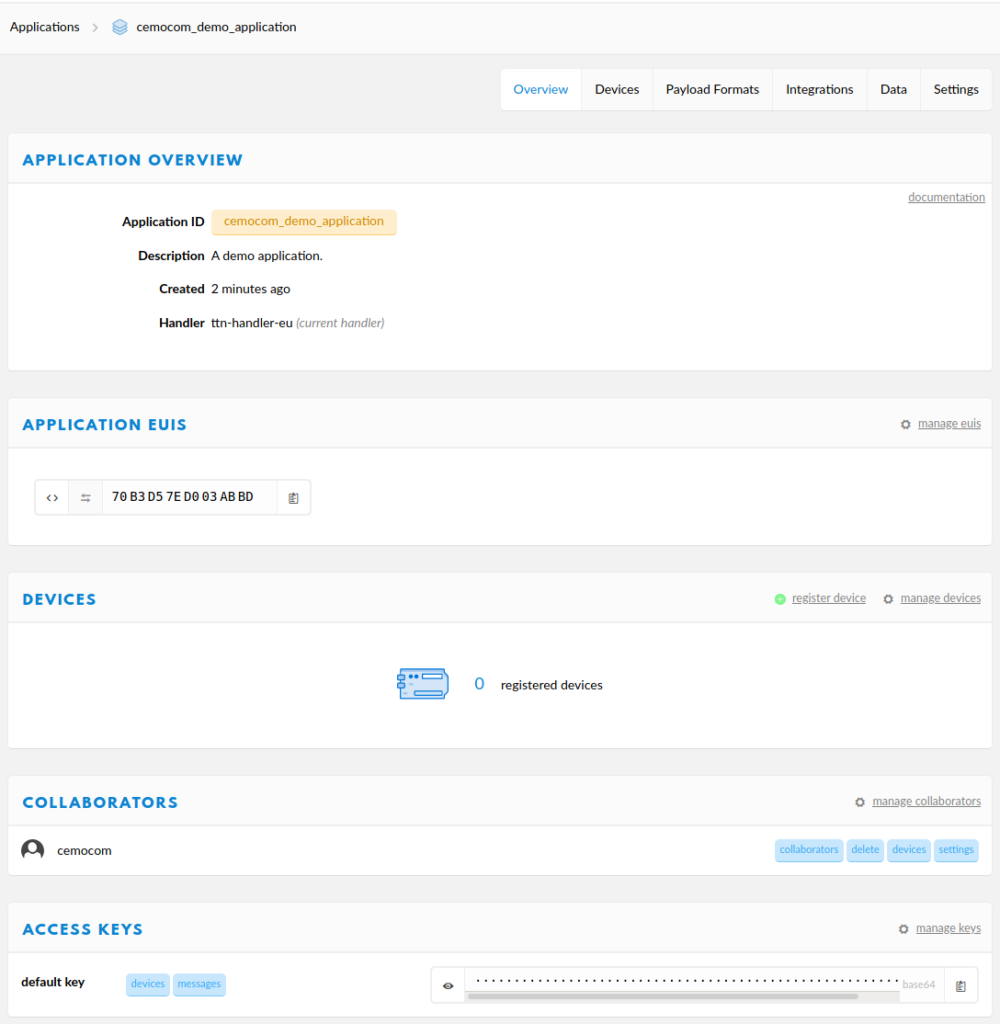
After creating the application devices can be added to the application a new dialog is shown that lists all details about the application.

TTN Application Overview

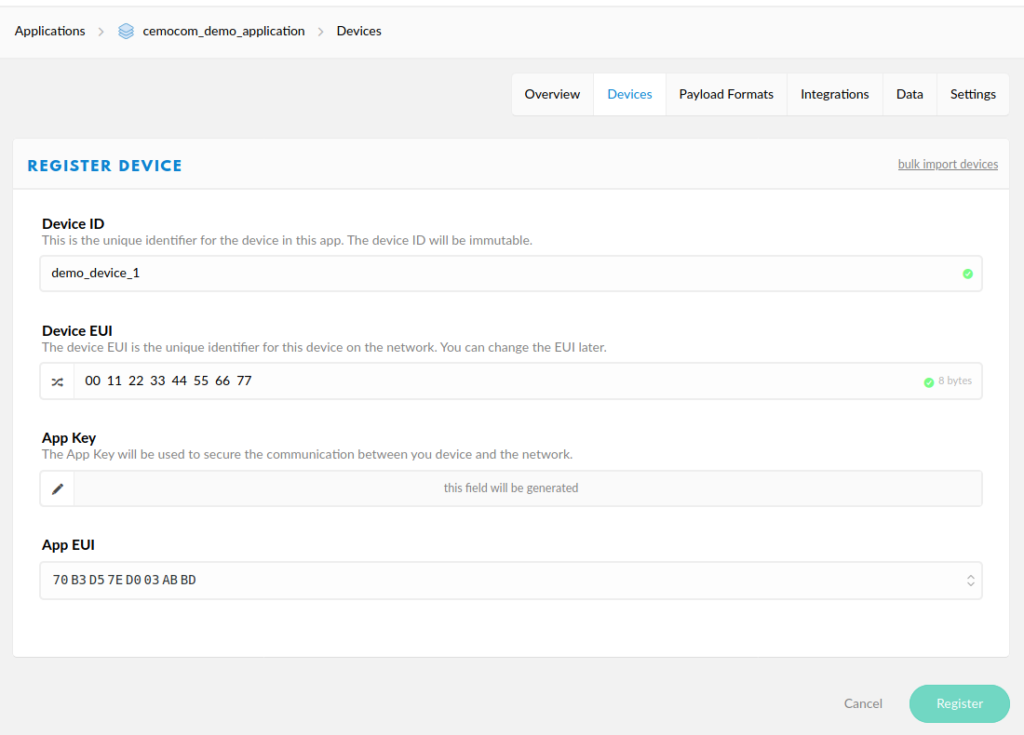
This dialog also shows all devices connected to the application. As we just created the application there are no devices available yet. But we can register a new device. For the registration we have to provide application wide unique device identifier and the network wide unique Device EUI. The Device EUI is a eight byte sequence. Use the identifier that was included with your Adafruit Feather. Pad with zero bytes if necessary. If the Device EUI is not know there is also the possibility to generate a random one.

TTN Device Registration

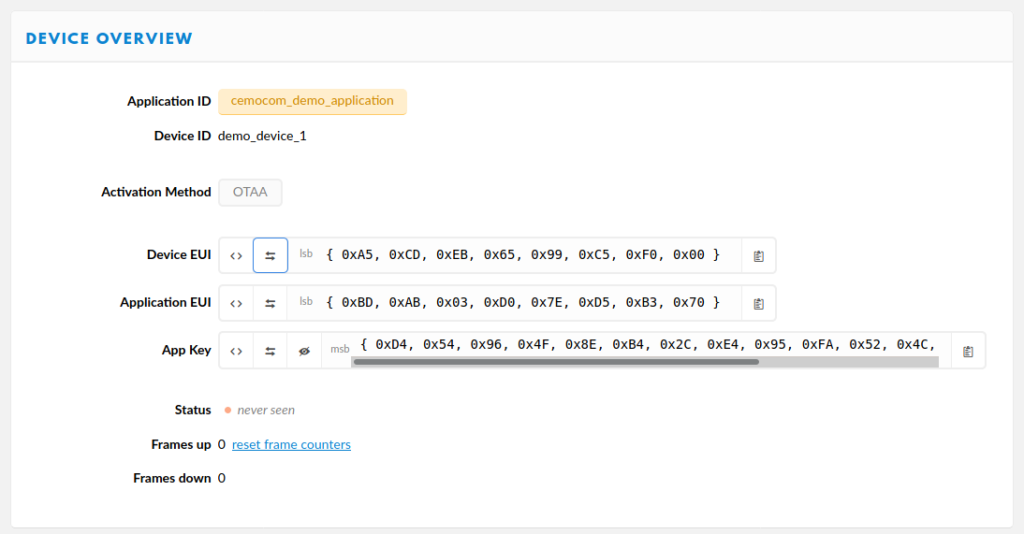
In the next dialog the relevant information to finally activate the device is shown. The Device EUI, Application EUI and App Key can be directly displayed in the correct format. Important for the next steps is that Device EUI and Application EUI are provided in LSB order.

TTN Device Details

Program the Adafruit Feather

The complete set-up of the Arduino IDE is skipped in this article. The most important steps are shown in the Adafruit tutorial. We use the MCCI’s arduino-lmic library to communicate with the TTN network, which can be installed using the library manager of the Arduino IDE. In the example below we do not transmit useful data, but only randomly generated data. In real implementations the function void readValues(unsigned char *vals) (line 182) could be used to write meaningful data into the variable vals.

The Device EUI, Application EUI and App Key from the previous steps have to be copied into the variables PROGMEM DEVEUI, PROGMEM APPEUI and PROGMEM APPKEY, respectively. These variables are located in the beginning of the code. Finally the transmit interval in seconds can be configured via the variable TX_INTERVAL in line 60.

Before flashing the program on the Feather M0, it is necessary to configure the region, i.e. the frequency, that shall be used. This is done in the file lmic_project_config.h located in the LMIC library folder of your Arduino IDE. Simply uncomment the region in which the device shall be used. Make sure that only one region is uncommented.

/*******************************************************************************
   Copyright (c) 2015 Thomas Telkamp and Matthijs Kooijman
   Adapted for Adafruit feather m0 LoRa by Stefan Huber

   Permission is hereby granted, free of charge, to anyone
   obtaining a copy of this document and accompanying files,
   to do whatever they want with them without any restriction,
   including, but not limited to, copying, modification and redistribution.
   NO WARRANTY OF ANY KIND IS PROVIDED.

   This example sends the actual battery voltage, using frequency and
   encryption settings matching those of the The Things Network.

   This uses OTAA (Over-the-air activation), where where a DevEUI and
   application key is configured, which are used in an over-the-air
   activation procedure where a DevAddr and session keys are
   assigned/generated for use with all further communication.

   Note: LoRaWAN per sub-band duty-cycle limitation is enforced (1% in
   g1, 0.1% in g2), but not the TTN fair usage policy (which is probably
   violated by this sketch when left running for longer)!
   To use this sketch, first register your application and device with
   the things network, to set or generate an AppEUI, DevEUI and AppKey.
   Multiple devices can use the same AppEUI, but each device has its own
   DevEUI and AppKey.

   Do not forget to define the radio type correctly in config.h.

 *******************************************************************************/

#include <lmic.h>
#include <hal/hal.h>
#include <SPI.h>
#include <avr/dtostrf.h>

// This EUI must be in little-endian format, so least-significant-byte first.
static const u1_t PROGMEM APPEUI[8] = {};
void os_getArtEui(u1_t *buf)
{
    memcpy_P(buf, APPEUI, 8);
}

// This should also be in little endian format, see above.
static const u1_t PROGMEM DEVEUI[8] = {};
void os_getDevEui(u1_t *buf)
{
    memcpy_P(buf, DEVEUI, 8);
}

// This key should be in big endian format.
static const u1_t PROGMEM APPKEY[16] = {};
void os_getDevKey(u1_t *buf)
{
    memcpy_P(buf, APPKEY, 16);
}

char mydata[16];
static osjob_t sendjob;

const unsigned TX_INTERVAL = 600;

const lmic_pinmap lmic_pins = {
    .nss = 8,
    .rxtx = LMIC_UNUSED_PIN,
    .rst = LMIC_UNUSED_PIN,
    .dio = {3, 6, LMIC_UNUSED_PIN},
};

void printHex2(unsigned v)
{
    v &= 0xff;
    if (v < 16)
    {
        Serial.print('0');
    }
    Serial.print(v, HEX);
}

void onEvent(ev_t ev)
{
    Serial.print(os_getTime());
    Serial.print(": ");
    switch (ev)
    {
    case EV_SCAN_TIMEOUT:
        Serial.println(F("EV_SCAN_TIMEOUT"));
        break;
    case EV_BEACON_FOUND:
        Serial.println(F("EV_BEACON_FOUND"));
        break;
    case EV_BEACON_MISSED:
        Serial.println(F("EV_BEACON_MISSED"));
        break;
    case EV_BEACON_TRACKED:
        Serial.println(F("EV_BEACON_TRACKED"));
        break;
    case EV_JOINING:
        Serial.println(F("EV_JOINING"));
        break;
    case EV_JOINED:
        Serial.println(F("EV_JOINED"));
        {
            u4_t netid = 0;
            devaddr_t devaddr = 0;
            u1_t nwkKey[16];
            u1_t artKey[16];
            LMIC_getSessionKeys(&netid, &devaddr, nwkKey, artKey);
            Serial.print("netid: ");
            Serial.println(netid, DEC);
            Serial.print("devaddr: ");
            Serial.println(devaddr, HEX);
            Serial.print("AppSKey: ");
            for (size_t i = 0; i < sizeof(artKey); ++i)
            {
                if (i != 0)
                    Serial.print("-");
                printHex2(artKey[i]);
            }
            Serial.println("");
            Serial.print("NwkSKey: ");
            for (size_t i = 0; i < sizeof(nwkKey); ++i)
            {
                if (i != 0)
                    Serial.print("-");
                printHex2(nwkKey[i]);
            }
            Serial.println();
        }
        LMIC_setLinkCheckMode(0);
        break;
    case EV_JOIN_FAILED:
        Serial.println(F("EV_JOIN_FAILED"));
        break;
    case EV_REJOIN_FAILED:
        Serial.println(F("EV_REJOIN_FAILED"));
        break;
    case EV_TXCOMPLETE:
        Serial.println(F("EV_TXCOMPLETE (includes waiting for RX windows)"));
        if (LMIC.txrxFlags & TXRX_ACK)
            Serial.println(F("Received ack"));
        if (LMIC.dataLen)
        {
            Serial.println(F("Received "));
            Serial.println(LMIC.dataLen);
            Serial.println(F(" bytes of payload"));
        }
        os_setTimedCallback(&sendjob, os_getTime() + sec2osticks(TX_INTERVAL), do_send);
        break;
    case EV_LOST_TSYNC:
        Serial.println(F("EV_LOST_TSYNC"));
        break;
    case EV_RESET:
        Serial.println(F("EV_RESET"));
        break;
    case EV_RXCOMPLETE:
        Serial.println(F("EV_RXCOMPLETE"));
        break;
    case EV_LINK_DEAD:
        Serial.println(F("EV_LINK_DEAD"));
        break;
    case EV_LINK_ALIVE:
        Serial.println(F("EV_LINK_ALIVE"));
        break;
    case EV_TXSTART:
        Serial.println(F("EV_TXSTART"));
        break;
    case EV_TXCANCELED:
        Serial.println(F("EV_TXCANCELED"));
        break;
    case EV_RXSTART:
        break;
    case EV_JOIN_TXCOMPLETE:
        Serial.println(F("EV_JOIN_TXCOMPLETE: no JoinAccept"));
        break;
    default:
        Serial.print(F("Unknown event: "));
        Serial.println((unsigned)ev);
        break;
    }
}

void readValues(unsigned char *vals)
{
    vals[0] = (unsigned char)rand();
}

void do_send(osjob_t *j)
{
    // Check if there is not a current TX/RX job running
    if (LMIC.opmode & OP_TXRXPEND)
    {
        Serial.println(F("OP_TXRXPEND, not sending"));
    }
    else
    {
        // Prepare upstream data transmission at the next possible time.
        unsigned char payload;
        readValues(&payload);
        Serial.print("Payload: ");
        Serial.println(payload);
        LMIC_setTxData2(1, &payload, 1, 0);
        Serial.println(F("Packet queued"));
    }
    // Next TX is scheduled after TX_COMPLETE event.
}

void setup()
{
    Serial.begin(9600);
    delay(10000);
    Serial.println(F("Starting"));

    // LMIC init
    os_init();
    // Reset the MAC state. Session and pending data transfers will be discarded.
    LMIC_reset();
    LMIC_setClockError(MAX_CLOCK_ERROR * 1 / 100);

    // Start job (sending automatically starts OTAA too)
    do_send(&sendjob);
}

void loop()
{
    os_runloop_once();
}

Conclusion

This article demonstrated the necessary steps to create a new TTN application and connect an Adafruit Feather M0 to it.

The next step would be to consume the transmitted data of the devices. The TTN console provides the possibility for data conversion using small JavaScript scripts. The received data can also be exported to own services, e.g. via MQTT or HTTP. This will be covered in a follow-up article.

Improved TheThingsNetwork Gateway Monitoring

In a previous post we showed how TTN gateways can be monitored using Prometheus. However, the presented solution had some limitations. For example it was only possible to monitor a single gateway. Also the code is now available on GitHub.

To support multiple gateways the output format has slightly be changed. The metrics for the different gateways can now be filtered by the label gateway_id.

# HELP python_gc_objects_collected_total Objects collected during gc
# TYPE python_gc_objects_collected_total counter
python_gc_objects_collected_total{generation="0"} 48.0
python_gc_objects_collected_total{generation="1"} 344.0
python_gc_objects_collected_total{generation="2"} 0.0
# HELP python_gc_objects_uncollectable_total Uncollectable object found during GC
# TYPE python_gc_objects_uncollectable_total counter
python_gc_objects_uncollectable_total{generation="0"} 0.0
python_gc_objects_uncollectable_total{generation="1"} 0.0
python_gc_objects_uncollectable_total{generation="2"} 0.0
# HELP python_gc_collections_total Number of times this generation was collected
# TYPE python_gc_collections_total counter
python_gc_collections_total{generation="0"} 59.0
python_gc_collections_total{generation="1"} 5.0
python_gc_collections_total{generation="2"} 0.0
# HELP python_info Python platform information
# TYPE python_info gauge
python_info{implementation="CPython",major="3",minor="9",patchlevel="1",version="3.9.1"} 1.0
# HELP process_virtual_memory_bytes Virtual memory size in bytes.
# TYPE process_virtual_memory_bytes gauge
process_virtual_memory_bytes 1.87236352e+08
# HELP process_resident_memory_bytes Resident memory size in bytes.
# TYPE process_resident_memory_bytes gauge
process_resident_memory_bytes 3.1379456e+07
# HELP process_start_time_seconds Start time of the process since unix epoch in seconds.
# TYPE process_start_time_seconds gauge
process_start_time_seconds 1.60917394427e+09
# HELP process_cpu_seconds_total Total user and system CPU time spent in seconds.
# TYPE process_cpu_seconds_total counter
process_cpu_seconds_total 0.13999999999999999
# HELP process_open_fds Number of open file descriptors.
# TYPE process_open_fds gauge
process_open_fds 8.0
# HELP process_max_fds Maximum number of open file descriptors.
# TYPE process_max_fds gauge
process_max_fds 1024.0
# HELP ttn_gateway_messages_uplink Number of uplink messages
# TYPE ttn_gateway_messages_uplink gauge
ttn_gateway_messages_uplink{gateway_id="eui-1"} 10.0
ttn_gateway_messages_uplink{gateway_id="eui-2"} 20.0
# HELP ttn_gateway_messages_downlink Number of downlink messages
# TYPE ttn_gateway_messages_downlink gauge
ttn_gateway_messages_downlink{gateway_id="eui-1"} 1.0
ttn_gateway_messages_downlink{gateway_id="eui-2"} 2.0
# HELP ttn_gateway_messages_rx_ok Number of rx_ok messages
# TYPE ttn_gateway_messages_rx_ok gauge
ttn_gateway_messages_rx_ok{gateway_id="eui-1"} 10.0
ttn_gateway_messages_rx_ok{gateway_id="eui-2"} 20.0
# HELP ttn_gateway_messages_tx_in Number of tx_in messages
# TYPE ttn_gateway_messages_tx_in gauge
ttn_gateway_messages_tx_in{gateway_id="eui-1"} 1.0
ttn_gateway_messages_tx_in{gateway_id="eui-02c10afffe41d2a3"} 2.0

Monitoring POCSAG Networks using a SDR

This article demonstrates how the POCSAG pager network can be monitored and the transmitted messages can be read.

Background

The POCSAG protocol used to operate pager networks is already several decades old but still in use. There are multiple networks available world wide operated by commercial network operators. The communication is by default unencrypted so it can be received and understood by anyone.

This article shows how a SDR and open source software can be used to receive and display POCSAG messages.

Needed Hardware and Software

The needed hardware is quite inexpensive and the software is available as open source, such that the entry barrier to start own experiments is quite low.

Hardware

In principle any software defined radio (SDR) covering a frequency range up to 800 MHz should be suitable to monitor POCSAG communication. This includes also RTL-SDR USB sticks which allow an inexpensive start into the SDR world. The RTL-SDR was initially produced as DVB-T tuner and is available for around 25€. However, we use a LimeSDR receiver in this article.

Software

The following software is necessary. In a Linux system it can usually directly be installed using the distribution’s package management system. Additionally appropriate drivers for the used SDR are required.

GQRX is graphical frontend for the SDR. It is used to configure the SDR, e.g. the correct frequency or modulation scheme. It also offers the possibility to to forward the received signal stream via UDP to other applications.

SoX is the self-claimed Swiss army knife of sound processing programs. It is used to down-sample the received signal stream from GQRX such that it can be processed by the final program – multimon-ng.

Multimon-ng is able to decode multiple digital communication protocols. The list of supported protocols includes also POCSAG.

Configuration

The first step is to figure out which POCSAG networks are available in your region and on which frequency they are operating. As a starting point have a look in this Wikipedia article.

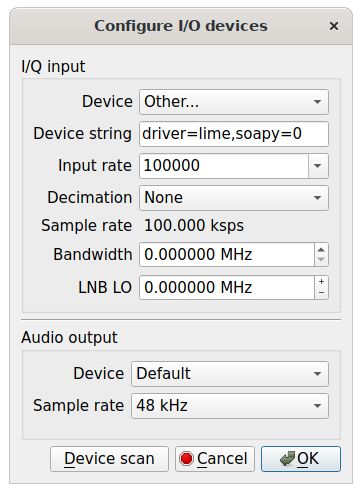
Depending on the used SDR device, the configuration of GQRX is different. For a LimeSDR the following configuration works.

GQRX device configuration

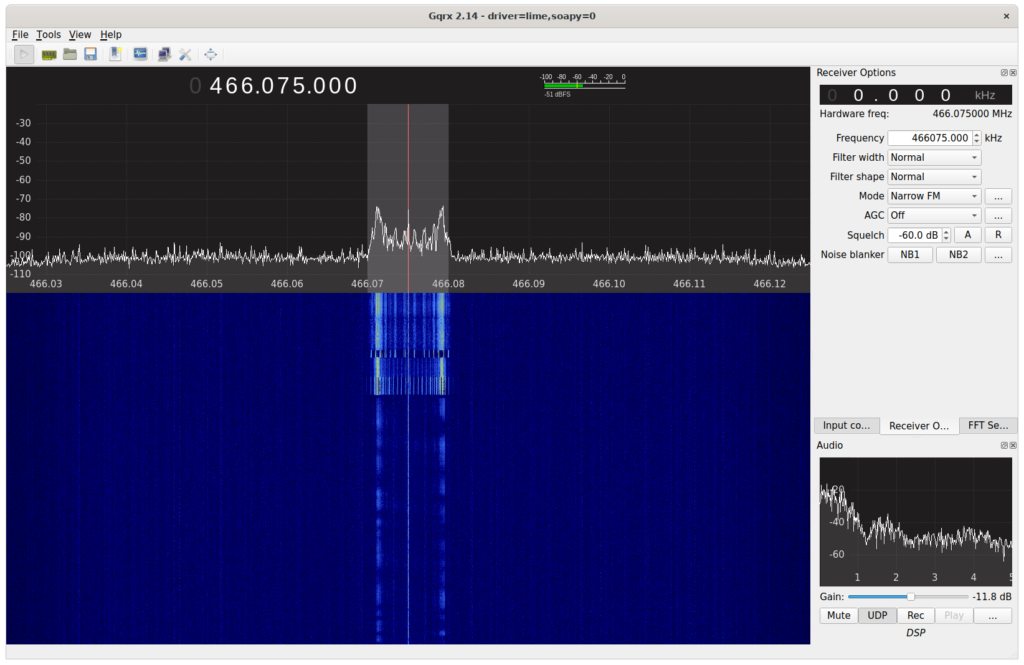
The receiver options can be configures as shown in the next picture. The AGC as well as the squelch options can still be improved depending on the used hardware.

GQRX receiver configuration

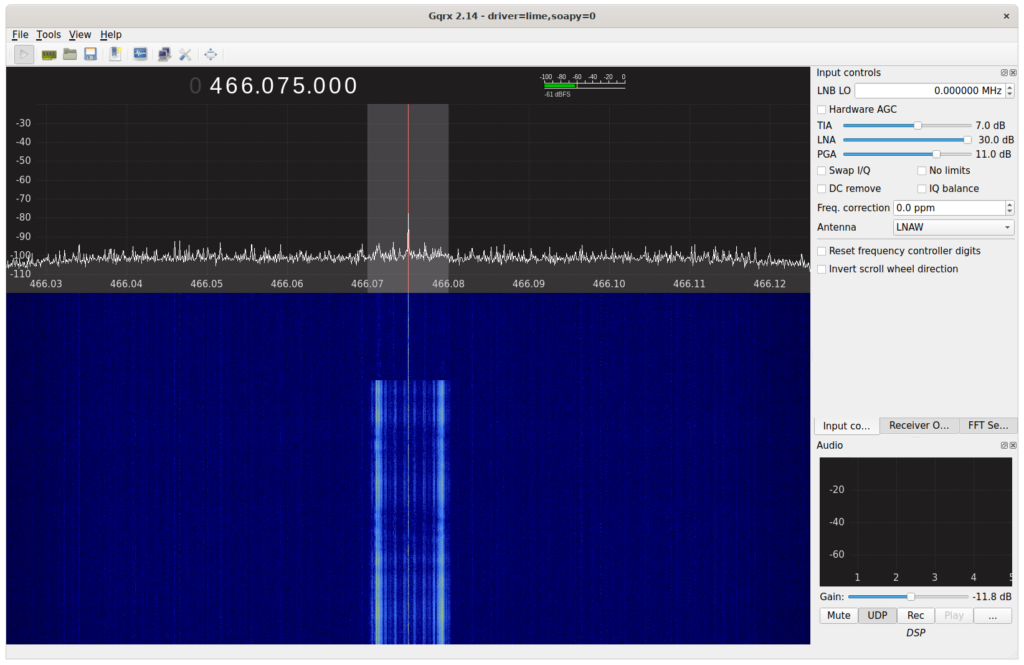
The input controls as shown as in the next image can act as a starting point. Fine tuning of the gain controls is recommended as these depend on the used hardware equipment.

GQRX input controls
GQRX input controls

The final configuration step in GQRX is to enable UDP output such that the received and demodulated audio signal can be used by other programs. This can be done by selecting the UDP button on the lower right window. By default GQRX opens a UDP socket on port 7355.

The decoding of the received signal is done with multimon-ng. It can be started in a console with the following command.

nc -l -u localhost 7355 | sox -t raw -esigned-integer -b16 -r 48000 - -t raw -esigned-integer -b16 -r 22050 - | multimon-ng -t raw -a POCSAG512 -a POCSAG1200 -a POCSAG2400 -f alpha -e  --timestamp -

After a while you should be able to see decoded messages in the terminal window.

TheThingsNetwork Gateway Monitoring

Background

In a previous post we showed how to setup a new TheThingsNetwork gateway. After successfully building a gateway and connecting it to TTN, probably one of the most interesting information for gateway operators is how frequently the gateway is used. This information is available on the TheThingsNetwork Console, but of course we want to access this data via API so that we can use it in multiple ways. One option would be to create a Grafana dashboard and display the transmitted and received messages. TTN provides a public API, but there the interesting information is not included.

Reverse Engineering the TTN API

If we have a closer look on the requests the TTN console performs to display the number of transmitted messages, we can identify the following requests.

POST https://account.thethingsnetwork.org/api/v2/users/login

In this request we have to provide our credentials as body as {"username": "user", "password": "pass"}. After a successful response we also receive one session cookie for thethingsnetwork.org and two cookies for account.thethingsnetwork.org. With these cookies we can perform the second request.

GET https://console.thethingsnetwork.org

With this request we obtain three cookies for console.thethingsnetwork.org and we can directly perform the next request.

GET https://console.thethingsnetwork.org/refresh

This requests provides us the required JWT access token and its expiration data in its response. Using the token we obtain the gateway information in our last request.

GET https://console.thethingsnetwork.org/api/gateways

We have to use the access token from the previous request as bearer token and obtain the following JSON object.

[
    {
        "id": "eui-123",
        "activated": false,
        "frequency_plan": "EU_863_870",
        "frequency_plan_url": "https://account.thethingsnetwork.org/api/v2/frequency-plans/EU_863_870",
        "auto_update": false,
        "location_public": true,
        "status_public": true,
        "owner_public": false,
        "antenna_location": {
            "longitude": 9.0,
            "latitude": 48.0,
            "altitude": 0
        },
        "collaborators": [
            {
                "username": "username",
                "rights": [
                    "gateway:settings",
                    "gateway:collaborators",
                    "gateway:status",
                    "gateway:delete",
                    "gateway:location",
                    "gateway:owner",
                    "gateway:messages"
                ]
            }
        ],
        "key": "ttn-account-key",
        "attributes": {
            "brand": "Multi-channel Raspberry Pi gateway",
            "model": "Raspberry Pi with IMST iC880A",
            "placement": "indoor",
            "description": "TTN Gateway"
        },
        "router": {
            "id": "ttn-router-eu",
            "address": "eu.thethings.network:1901",
            "mqtt_address": "mqtts://bridge.eu.thethings.network:8882"
        },
        "fallback_routers": [
            {
                "id": "ttn-router-asia-se",
                "address": "asia-se.thethings.network:1901",
                "mqtt_address": "mqtts://bridge.asia-se.thethings.network"
            },
            {
                "id": "ttn-router-us-west",
                "address": "us-west.thethings.network:1901",
                "mqtt_address": "mqtts://bridge.us-west.thethings.network"
            },
            {
                "id": "ttn-router-brazil",
                "address": "brazil.thethings.network:1901",
                "mqtt_address": "mqtts://bridge.brazil.thethings.network"
            }
        ],
        "beta_updates": false,
        "owner": {
            "id": "",
            "username": ""
        },
        "rights": null,
        "status": {
            "timestamp": "2020-12-14T20:05:14.926987683Z",
            "uplink": 30,
            "downlink": 8,
            "location": {},
            "gps": {},
            "time": 1607976314926987683,
            "rx_ok": 30,
            "tx_in": 8
        }
    }
]

The interesting information is the status section at the bottom of the JSON response, which shows the total number of transmitted uplink and downlink messages.

Prometheus TTN Gateway Exporter

Using the information we have gathered so far, we can build a simple Prometheus exporter written in Python. The exporter performs the requests shown in the previous section and exposes the the number of uplink and downlink messages. For this a Web server provided by the prometheus_client library is used. This library also allows us the expose the TTN gateway statistics in a format that can directly be scraped by Prometheus. The source is shown in the following. Please note that the implementation has several limitations. E.g. only one gateway is supported at the moment.

import datetime
import random
import signal
import threading

import requests
from absl import app
from absl import flags
from absl import logging
from cachetools import cached, TTLCache
from prometheus_client import start_wsgi_server, Gauge

FLAGS = flags.FLAGS
flags.DEFINE_string('listen', ':9714', 'Address:port to listen on')
flags.DEFINE_string('username', None, 'Username to authenticate with')
flags.DEFINE_string('password', None, 'Password to authenticate with')
flags.DEFINE_bool('verbose', False, 'Enable verbose logging')

exit_app = threading.Event()

TOKEN = None
EXPIRES = None


def get_token(session):
    global TOKEN
    global EXPIRES
    logging.debug('get_token')
    now = datetime.datetime.now()
    if TOKEN and EXPIRES and EXPIRES > now:
        logging.debug('reuse existing token')
        return TOKEN
    else:
        logging.debug('get new token')
        login = {'username': FLAGS.username, 'password': FLAGS.password}
        res = session.post('https://account.thethingsnetwork.org/api/v2/users/login', data=login)
        res = session.get('https://console.thethingsnetwork.org')
        res = session.get('https://console.thethingsnetwork.org/refresh')
        json = res.json()
        TOKEN = json['access_token']
        EXPIRES = datetime.datetime.fromtimestamp(json['expires'] / 1000)
        return TOKEN


cache = TTLCache(maxsize=200, ttl=10)


def hashkey(*args, **kwargs):
    return args[0]


@cached(cache, key=hashkey)
def collect_metrics(metric):
    logging.debug('collect_metrics %s' % metric)
    session = requests.Session()
    local_token = get_token(session)
    header = {'Authorization': 'Bearer ' + local_token}
    res = session.get('https://console.thethingsnetwork.org/api/gateways', headers=header)
    gateways = res.json()
    gateway = gateways[0]
    if metric == 'uplink':
        return gateway['status']['uplink']
    elif metric == 'downlink':
        return gateway['status']['downlink']

    return random.random()


def prepare_metrics():
    logging.debug('prepare metrics')
    for metric in ['uplink', 'downlink']:
        g = Gauge('ttn_gateway_%s' % metric, 'Number of %s messages processed by the gateway' % metric)
        g.set_function(lambda m=metric: collect_metrics(m))


def quit_app(unused_signo, unused_frame):
    exit_app.set()


def main(unused_argv):
    if FLAGS.verbose:
        logging.set_verbosity(logging.DEBUG)
    if FLAGS.username is None or FLAGS.password is None:
        logging.error('Provide username and password!')
        exit(-1)
    logging.info(FLAGS.password)

    prepare_metrics()

    address, port = FLAGS.listen.rsplit(':', 1)
    start_wsgi_server(port=int(port), addr=address)
    logging.info(f'Listening on {FLAGS.listen}')
    for sig in (signal.SIGTERM, signal.SIGINT, signal.SIGHUP):
        signal.signal(sig, quit_app)
    exit_app.wait()


if __name__ == '__main__':
    app.run(main)

To execute the Python script a few requirements have to be met. These are:

absl-py
requests
prometheus_client
cachetools

After installing the requirements, the script can be executed with python ttn-gateway-exporter.py --username user --password pass. By default it listens on port 9714 on all network interfaces of the local machine. You are now able to access the metrics on http://localhost:9714. Besides the TTN statistics, named ttn_gateway_uplink and ttn_gateway_downlink also the Prometheus Python library returns also information about the process itself. An example output is shown below.

# HELP python_gc_objects_collected_total Objects collected during gc
# TYPE python_gc_objects_collected_total counter
python_gc_objects_collected_total{generation="0"} 7468.0
python_gc_objects_collected_total{generation="1"} 3830.0
python_gc_objects_collected_total{generation="2"} 0.0
# HELP python_gc_objects_uncollectable_total Uncollectable object found during GC
# TYPE python_gc_objects_uncollectable_total counter
python_gc_objects_uncollectable_total{generation="0"} 0.0
python_gc_objects_uncollectable_total{generation="1"} 0.0
python_gc_objects_uncollectable_total{generation="2"} 0.0
# HELP python_gc_collections_total Number of times this generation was collected
# TYPE python_gc_collections_total counter
python_gc_collections_total{generation="0"} 83.0
python_gc_collections_total{generation="1"} 7.0
python_gc_collections_total{generation="2"} 0.0
# HELP python_info Python platform information
# TYPE python_info gauge
python_info{implementation="CPython",major="3",minor="7",patchlevel="3",version="3.7.3"} 1.0
# HELP process_virtual_memory_bytes Virtual memory size in bytes.
# TYPE process_virtual_memory_bytes gauge
process_virtual_memory_bytes 8.8424448e+07
# HELP process_resident_memory_bytes Resident memory size in bytes.
# TYPE process_resident_memory_bytes gauge
process_resident_memory_bytes 3.2833536e+07
# HELP process_start_time_seconds Start time of the process since unix epoch in seconds.
# TYPE process_start_time_seconds gauge
process_start_time_seconds 1.60797857466e+09
# HELP process_cpu_seconds_total Total user and system CPU time spent in seconds.
# TYPE process_cpu_seconds_total counter
process_cpu_seconds_total 3364.25
# HELP process_open_fds Number of open file descriptors.
# TYPE process_open_fds gauge
process_open_fds 24.0
# HELP process_max_fds Maximum number of open file descriptors.
# TYPE process_max_fds gauge
process_max_fds 1024.0
# HELP ttn_gateway_uplink Number of uplink messages processed by the gateway
# TYPE ttn_gateway_uplink gauge
ttn_gateway_uplink 33.0
# HELP ttn_gateway_downlink Number of downlink messages processed by the gateway
# TYPE ttn_gateway_downlink gauge
ttn_gateway_downlink 9.0

Outlook

In the future an improved version of the Prometheus exporter might be provided. For now just use the shared code snippets and adapt them to your needs.